


The Comprehensive Jumia IPO Analysis (Part 2)
by Olumide "D.O" Olusanya, Founder Collective Africa
Catch up with Part 1 here, if you haven’t already read it. This is a continuation.
PART 2
JUMIA’S CUSTOMER UNIT ECONOMICS ANALYSIS
The next section “Growth and engagement of our Active Consumers” dealing with customer engagement and growth metrics is very important. It allows us to do rough calculations of Jumia’s customer unit economics, which they indicated in the below is the most important driver of their 3 core KPIs.

Jumia does customer cohort analysis on an annual basis, with each customer cohort defined as consumers who made their first purchase during a specific period. They then track the additional purchases made by consumers in each cohort during the period in which these consumers were acquired, as well as in subsequent periods. They have tracked customer cohorts since 1st January 2013. What this means is that all customers that made their first purchase in year 2013 constitute one cohort—the 2013 cohort. Those that made their first purchase in year 2014 belong to the 2014 customer cohort and so on, up till the 2018 cohort, which will be their latest cohort before this 2019 IPO filing.
So now we dig in into the data provided: “Every consumer cohort since 2013 had a repeat purchase rate during the year in which consumers in the relevant cohort made their first order of 28% to 39% and a repeat purchase rate during the following year of 21% to 31%. We observed that our 2018 cohort had the highest level of first year repurchase (39%) and our 2017 cohort had the second highest level (34%), demonstrating the relevance of our platform for consumers and its continued adoption by them.”
Interpretation: since Jumia started doing their customer cohort analysis in 2013 on an annual basis up till the 2018 FYE, they observed that a range of 28% to 39% of customers making their first purchases within a certain year across the years from 2013 to 2018 came back to make another purchase in that same year they made their first purchases and between 21% to 31% of their customer cohorts between 2013 and 2017 returned the year following their first purchases to perform an additional purchase. To keep this simple for us, we will just use averages. So it means, on average, 33.5% of customers performing a first purchase in a particular year return to make at least one purchase in that same year and, on average, 26% return the following year to make at least one more purchase.
Before we go further, the first challenge I have with interpreting this section is that you will observe that the word PURCHASE is being used in their customer cohort definition of terms. What I am not sure of is how Jumia is using the term purchase in this section on customer cohort analysis dealing with active customers compared to how they used it in their previous definition of active customers. To refresh your memory from Part 1, I quote:


So, one cannot really tell if Jumia is using purchase in the way they have defined “place an order” in the above or in the true sense of how purchase should be used in English language:

In any case, the most prudential thing to do is to interpret purchase in this customer cohort analysis section with the same level of distrust with which we interpreted the active customer numbers that was provided, on account of their fuzzy definition of what it means to be an active customer or place an order or make a purchase. Consequently, the sense one begins to get is that, even with the goosed definitions of purchase potentially making their cohort analysis data much rosier than it may be, even at that it is quite shitty! Why?
Stay with me.
Back to cohort analysis data: “We observed that our 2018 cohort had the highest level of first year repurchase (39%) and our 2017 cohort had the second highest level (34%), demonstrating the relevance of our platform for consumers and its continued adoption by them.” Wait! 2018 had the highest level of first year repurchases at 39%?! Those shenanigans alarm bells are going off in my mind again! I cannot help it. So, the most prudential thing to do then is to use the lower ranges they provided in their cohort analysis data and not even the averages I had earlier suggested above because these will be less susceptible to the goosed spikes we saw in active customer data for 2018, from Part 1.

To rephrase, I will use the following provided data as the basis for my analysis Jumia’s customer cohorts: “28% of customers performing a first purchase in a particular year return to make at least one purchase in that same year and, on average, 21% return the following year to make at least one more purchase.” Jumia did not however explicitly provide us customer cohort data beyond the year following the year of first purchase i.e we are only provided with Year 0 and Year 1 data. We should have at least been presented with Year 0 to Year 5 cohort data for the 2013 customer cohort, being the longest one. Consequently, I have decided to do a straight line trend analysis drawn forward from the 2 data points provided for Year 0 and Year 1, extending their trend line to Year 5, which gives one 6.6% for retention of 2013 customer cohort as at year end 2018.
If we further discounted this by what we estimate Jumia’s active customer numbers may have been goosed by, using their existing trend line for active customers from between 2013 to 2017, i.e. by 30%, that gives us 4.6% cohort retention by Year 5.

So, I am choosing this as the cohort retention rate 4.6%—and therefore churn rate 95.4%—for my calculation of Jumia’s Customer Life Time Value (CLTV) as a way of doing my best to de-goose the numbers they have provided as is materially possible, based on the defects we have already seen from how they have chosen to define standard terms to suit their purpose and aims. CLTV, in simple terms, is the cumulative Net Present Value (NPV) of the Gross Profits made averagely per customer per year for the lifetime of that customer being a customer with Jumia. There are a few formulas available with which to derive CLTV. One of the simplest ones is
CLTV = 1/Churn rate x ARPU x Gross Margin,
where ARPU, in this instance, will be average GMV per active user per annum,
and Gross Margin will be average Gross Margin on that GMV, which we had found in Part 1 was…


Consequently, the best case for Jumia’s CLTV, based on their provided numbers, if accepted as is, therefore is = 1/0.79 x €210 x 0.041 = €10.90
A worse case for Jumia’s CLTV, my preference, based on me doing the best I could possibly do to keep their numbers as honest as possible is
= 1/0.954 x €210 x 0.021 = €4.62.
However, whether best case or worst case, makes no difference—when you flip their CLTV and look at the other side of the coin of their Customer Unit Economics, which is Customer Acquisition Costs (CAC).
The data they seem to be suggesting we use as CAC is a trick.

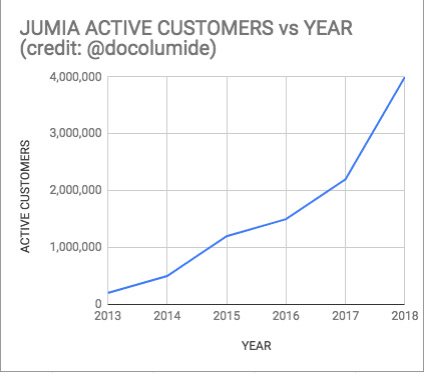
It understates the implied CAC by using total number of active customers in year 2017 and 2018 as denominator to Sales and Advertising expense for those years as basis of deriving this. No! What should be used as denominator is the NEW customers won in each of those years. So denominator for 2017 should be “2.1m - 1.5m = 0.6m”—not 2.1m customers, as was used by Jumia to derive the €14 they are seemingly implying to stand for CAC, from the €38m spent as Sales and Advertising for 2017. Similarly for 2018 it should be “4m - 2.1m = 1.9m”—not 4m customers, as was used by Jumia to derive the €12 they are seemingly implying to stand for CAC, from the €48m spent as Sales and Advertising for 2018. Hence, correct CAC for 2017 would be €38m/0.6m, which equals €63 and the CAC for 2018 would be €48m/1.9m, which equals €25.

As I did in the cohort analysis section, I will skew more towards using the 2017 figure to remove the effect of potential goosing of the active customer numbers in 2018. So there you have it: shitty Customer Unit Economics, spending €63 to acquire customers who at best have a lifetime value of €11 and at worst €5!!!
This song, O.D.O.O, by Fela Anikulapo Kuti best describes this scenario. Enjoy!
<End of Part 2>