


The Comprehensive Jumia IPO Analysis (Part 1)
by Olumide "D.O" Olusanya, Founder Collective Africa
Five months ago, I did a 120 tweet thread to do an analysis of the Jumia IPO immediately after the filing. I covered the initial 40% of the IPO filing and lost interest. This Comprehensive Analysis starts with the 120 tweet thread, laid out in the first part—Part 1—of this post in fluid prose. I am going to break the remaining 60% I am yet to cover into Part 2 - Part n, word size of each limited by as many as would fit in the maximum word size allowable by SubStack in one single newsletter. I will subsequently dedicate the time after these to analysis of Jumia’s Q1-2019 and Q2-2019 reports and investor calls.
PART 1
INTRO
Here's their F1 filing.
The approach I am going to take is to take screen captures of sections of the F1 filing that catch my fancy. Then, I will follow these up with general topics relating to building an ecommerce business and use Jumia’s as case study in these, comparing Jumia to other ecommerce benchmarks. My go-to benchmark is StitchFix. Just as Jumia, StitchFix IPO’ed after approximately the same number of years (~6 years) in operations and hitting ~$1billion GMV in its last FY before its IPO.
Before I go any further, please let’s be clear: I think what these guys have managed to accomplish *in Africa* is phenomenal! This is something Naspers has tried not once, twice or thrice, and have had to beat retreats back to South Africa on each occasion, before finally throwing in the towel last year. So, I have huge respect for these guys for what they have managed to pull off, with the warts and all. What I’m simply doing here is more of an intellectual exercise, an analysis of the business itself as an ecommerce venture in comparison to best-in-class ecommerce.
TABLE OF CONTENT

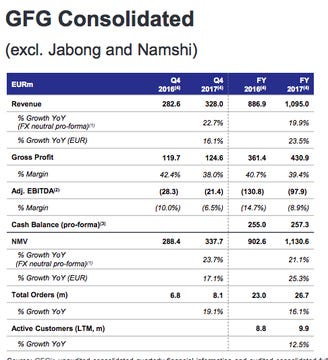
Everything in the above is what has become of the legacy African Internet Holding (AIH), consisting of originally of Jumia, Zando, Kaymu, Hellofood, Lamudi, Carmudi, Jovago, Easy Taxi, Lendico, which were later all folded under the Jumia umbrella brand, as in below.

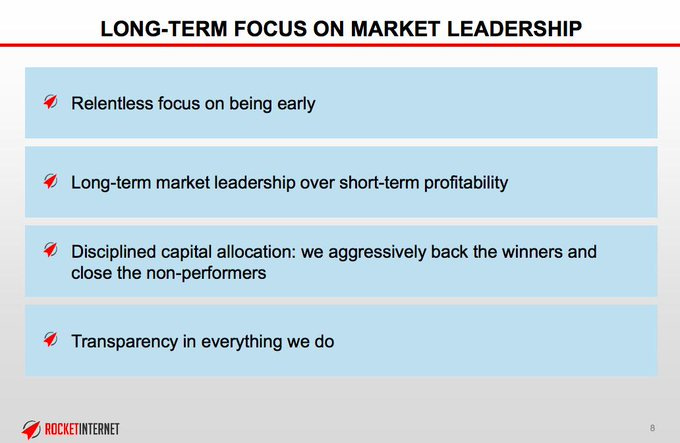
You will observe that three of these (Easy Taxi, Lendico and Carmudi) of the nine ventures/services are non-existent, leaving only the ecommerce (Jumia & Zando), food ordering (HelloFood), hotels/travels (Jovago), classifieds/deals (Kaymu) and house/properties (Lamudi) as the surviving ventures/services comprising the Jumia umbrella brand. This is not surprising, Rocket’s philosophy right from onset had been, from their first public presentation in 2014, to “aggressively back the winners and close the non-performers.”
Although they have these other services, ecommerce really is the heart of their value proposition, it’s what they and this IPO are really about.
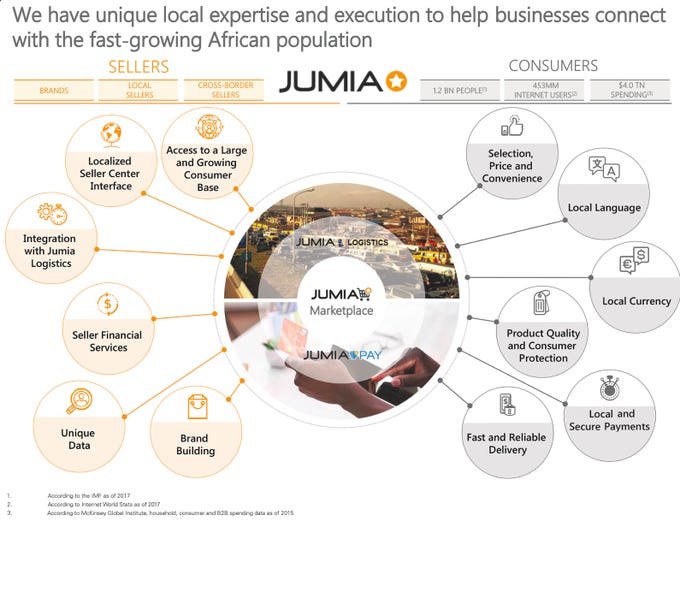
Above depicts a 2-sided marketplace architecture with their tripartite marketplace, logistics and payments engines at the heart of the respective services they offer both sides—consumer and seller—of their business.
DEFINITION OF KEY TERMS USED IN THE PROSPECTUS
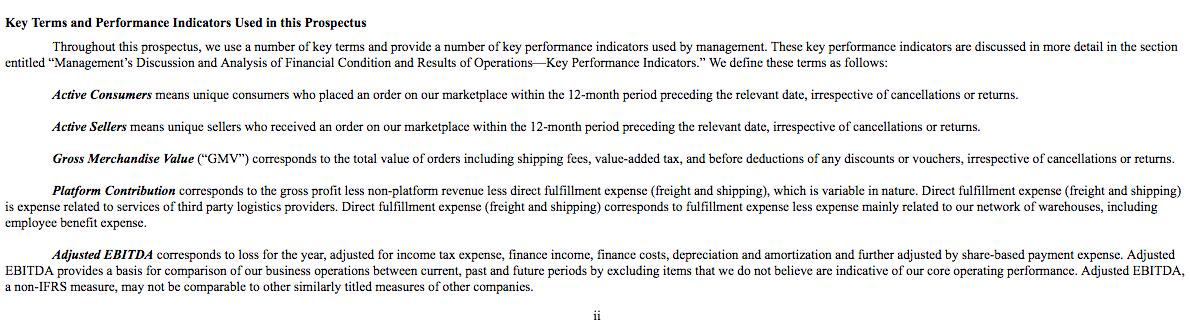
This section is the most critical section for interpreting the numbers in this F1 filing. Why? I quote from somewhere in the filing: “We assess the success of our business through a set of key performance indicators such as the number of Active Consumers, GMV and Adjusted EBITDA.” It is their measure of success and so these definitions need to be taken through with a fine comb. Consequently, I will spend what may seem an inordinate amount of ink on this small section of the filing. It reveals their definition of these three (3) key performance indicators(KPIs)—active customers, active sellers and gross merchandise volume (GMV)—associated with the three aspects of the marketplace model diagram in the foregoing section. What is most remarkable about these definitions is that these definitions are INCLUSIVE of order cancellations and returned orders!
For the avoidance of doubt, I took the pain to capture the dictionary definition of what “irrespective” in the above definitions mean. Now, this is really crazy! I repeat: this is REALLY crazy!

What is order cancellation? Order cancellation is when an order placed by a customer is voided before it is shipped out for fulfillment. What's Return? Order return is when a customer order is returned back to the fulfillment centre (FC) after it has been shipped out of the FC. With this very important distinctions in mind, let’s sift through the definition of each of those three KPIs. To show just how so very crazy Jumia’s definition of their KPIs are, so you get the implications of these funny definitions, I will zero in on each.
Active Consumers
“Active Consumers means unique consumers who PLACED an order on our marketplace within the 12-month period preceding the relevant date, IRRESPECTIVE OF CANCELLATIONS OR RETURNS.”
The key words are in CAPS. What does this mean? It means when someone clicks the CHECKOUT button on the Jumia ecommerce website, which is what it means to PLACE an order, it is AUTOMATICALLY counted as a data point in their definition of active customers, active sellers and GMV---even if that customer calls within 5 minutes of placing that order saying “cancel that order” or if for ANY reason before they ship out that order, that order ends up being cancelled.
What happens in the ecommerce processing systems after cancellation is that the items shopped by the customer is added back to inventory, if customer paid online money's credited back to him, if it’s a cash-on-delivery (CoD) order, invoice is automatically voided, if items have been picked and/or packed, they're returned back to the shelf or to the merchant (if it is a marketplace product), etc, etc, etc. You get the drift? Okay! So, why is this crazy?
If I wanted to hit an active customers target ahead of IPO by goosing numbers, based on Jumia’s own definition of ACTIVE, all I’d have to do is get a significant number guys (👀JForce👀) and tell them to be creating unique email addresses and placing CoD orders which they then immediately cancel after they have created them. That way, each unique email generated and used to create a customer profile on the system is COUNTED as an active customers, each seller the order is placed against is COUNTED as active sellers, and whatever items were in such orders placed are COUNTED as part of GMV--provided this happened anytime between 1st January and 31st December. (By the same way, I can also goose the number of sellers on the marketplace since actual physical inventory isn't required to be a seller, just product pictures.)
Remember, when I said “not all GMVs are equal in the below tweet earlier this year?

Yeah! This is the perfect showcase of that tweet. Now, this is a system therefore that allows me to goose and ramp this reported number up overnight. Hence, the first place you know there MAY be a funny problem with the 4 million active customers they are claiming is when you go back to Jumia’s historic active customers from their previous public reports.

You can see from the chart that it implies they got almost 2 million more additional active customers in 2018 alone, which is about the same amount of active customers they had managed to gather from the 5 years of operations from 2013-2017 preceding 2018. Clearly, business was CRAZY GOOD for Jumia in 2018. (Note: I’m not YET claiming any shenanigans. You're free to make up your own mind on that at this point if you want. However, I know how to use their financial data to test if there was shenanigans. So, if you avoid jumping to conclusions, I will get to that in a bit--if you are patient.)
Active Sellers
“Active Sellers means unique sellers who RECEIVED an order on our marketplace within the 12-month period preceding the relevant date, irrespective of cancellations or returns.” From my previous explanation you certainly do not need me to explain this again as it's the other side of Active customers. It just means if a seller receives just AN EMAIL of an order PLACED on the Jumia site, he is COUNTED as active seller--even if that order was immediately cancelled within minutes of it being placed. And, I have also indicated how this one too can be goosed in my previous explanation of active customer. We cannot however chart this because it was not a metric captured in Jumia’s previous public reports
General Merchandise Value (GMV)
This is the MOST CRUCIAL of the three definitions. Why? BECAUSE it is the one UPON which the Jumia VALUATION and share price will mostly be based! According to Jumia—not me—their “Gross Merchandise Value (“GMV”) corresponds to the TOTAL VALUE of orders INCLUDING shipping fees, VALUE-ADDED TAX and BEFORE DEDUCTIONS of any discounts or vouchers, IRRESPECTIVE OF CANCELLATIONS OR RETURNS.” Boom!!!
The trick in this definition is that they deliberately dropped an important keyword from this definition compared to the previous two definitions of their KPIs. The keywords are “placed” and “received.” So, I've added it back so it is clear orders that have just simply been PLACED on the Jumia website are still what we are talking about here--INCLUDING THE ONES THAT WERE CANCELLED OR RETURNED! Yes, according to their definition, they are INCLUDED in the value of the GMV they are reporting! Not only that, it also means this value INCLUDES all the 50% discounts given during Black Fridays.
What beats me is how they are even counting VAT as part of GMV. That’s an extra 5% goosing of GMV--depending on what the aggregate VAT %age comes to across their 14 countries of operations. I observed that in their previous annual reports, they define GMV of their GFG fashion ecommerce as excluding VAT, as it ordinarily should be, but always include VAT as part of GMV for Jumia. Why? Don’t ask me. See for yourself.


Below is my chart of their GMV when you use the term based on their own definition of this key term.
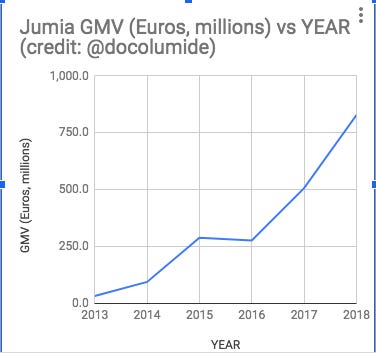
Hopefully, later if the data provided is adequate, I will make an attempt to tear down this goosed up GMV to get to the TRUE GMV by backing out everything that they have deliberately wrongfully included in it.
MORE DEFINITIONS OF KEY TERMS
Next in the order of definitions: “Platform Contribution corresponds to the gross profit less non-platform revenue less direct fulfillment expense (freight and shipping), which is variable in nature. Direct fulfillment expense (freight and shipping) is expense related to services of third party logistics providers. Direct fulfillment expense (freight and shipping) corresponds to fulfillment expense less expense mainly related to our network of warehouses, including employee benefit expense.”
This basically defines contribution margin related to their core ecommerce business of delivering the ordered goods to customers hands. Remember this my old tweet on unit economics of ecommerce, with picture taken from one of Rocket’s presentation?

Yes, PC1 in there is gross profit and PC2 is contribution margin, as also indicated in my said tweet. This essentially is what they are attempting to define here. You arrive at PC2 (platform contribution margin) by deducting the cost that are DIRECTLY associated with getting the ordered products from the gross profits derived DIRECTLY from orders delivered, after deducting all the funny costs that they included in their definition of GMV earlier. Furthermore, in their definition they didn’t include costs associated with their warehouses because this are mostly indirect and/or fixed costs that are not necessarily, proportionally driven by higher volumes of orders delivered. Consequently, what this basically measures is the actual value being created by their core ecommerce activity of delivery packages to customers i.e. whether they actually make any money per unit of value of orders they deliver to customers.
Worthy to note is that in the summary section ahead they indicated “in Nigeria, our largest and most mature geographic market, our platform contribution after other fulfillment expense was positive 0.9% of GMV in the 2nd half of 2018, up from negative 2.0% during the same period in 2017.” It means up until the end of 2017, on average, every N1,000 of ordered items Jumia that are delivered in Nigeria, they lost N20 on it. But do note that people always put their best foot forward, which means all the other locations ex-Nigeria are probably worse than this and are still negative contribution ecommerce operations even as at last year. Unfortunately, this is not something one is able to chart across 6 yrs and, therefore, we will have to make do with just the 2 yrs provided in this IPO filing. 46/n
Now, while we are on that: it is interesting that Rocket chose to stick to the minimum number of years allowed for reporting under F1 filing rules (2 years) instead of the traditional 5 years of the S1. Why is this? Personally, I think it is because they want to make it easy for people to interpret their numbers. There was a significant business model changed between 2014 and 2016 involving changing from 1st party ecommerce to 3rd party marketplace model and then amalgamating the other Rocket ventures under the Jumia umbrella brand. 2017 and and 2018 are the only 2 years where these changes had pretty much settled and been completed.
For example, in terms of business model change, more and more of their revenue came from the rake they charged 3rd party merchants as they moved more and more to 3rd party marketplace model, which means though they were doing more and more GMV less and less of it was being reported as revenue. If you don’t understand this and you are reading their report for the first time in this IPO, you may think it a negative thing that revenue dropped or has so far not increased beyond the level it was in 2015 when indeed it is a positive thing, as it implies the resulting lower revenue accruing to them is of a much higher quality as most of it percolates down to gross profits. Explains why, in the charts, even though GMV grew between 2014 and 2016 revenue dropped (both in actual value and as factor of GMV) but gross profits continued to grow, and is therefore the only metric that removes the effects of the business model changes between those mid-years


Anyway, that is a digression. Back to definitions.
The final one: “Adjusted EBITDA corresponds to loss for the year, adjusted for income tax expense, finance income, finance costs, depreciation and amortisation and further adjusted by share-based payment expense. Adjusted EBITDA provides a basis for comparison of our business operations between current, past and future periods by excluding items that we do not believe are indicative of our core operating performance. Adjusted EBITDA, a non-IFRS measure, may not be comparable to other similarly titled measures of other companies.” This is what corresponds to PC4 in this my tweet, if you can call it that.
It basically means all the loss they incurred after they have backed out all other expenses from the total contribution to the core business (total PC2). However, they do not include expenses that are not core to the operations of the business or are non-cash expenses; hence, they do not include income tax expenses, finance costs, finance income, depreciation and amortisation expense and adjusted share-based compensation as part of the expenses they deduct from total contribution from the core operations.
LISTING
I'm jumping the "Summary" section because "This summary highlights information contained in more detail elsewhere in this prospectus. This summary may not contain all information that may be important to you, and we urge you to read this entire prospectus carefully...." So, that's what I'm going to do!
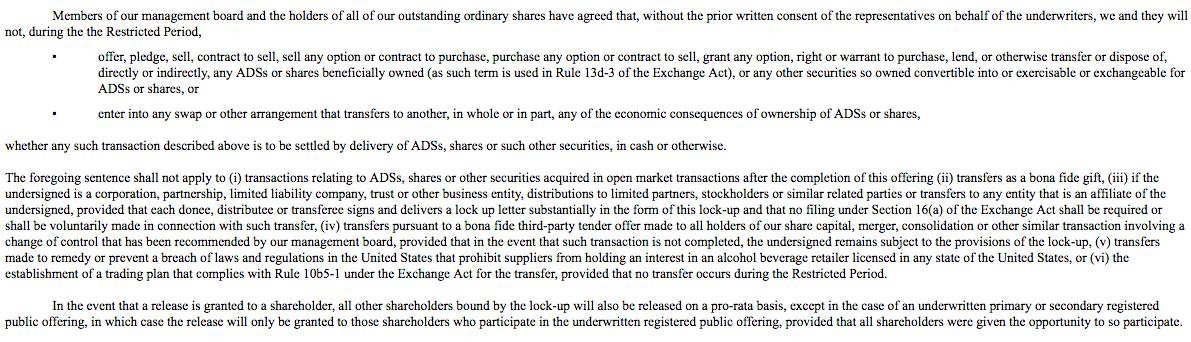
Next, "Listing": the most significant thing to me here is the Lock-Up terms. It clearly says that "...the holders of all of our outstanding ordinary shares have agreed to substantially similar 180-day lock-up provisions, subject to certain exceptions. See 'Underwriters.'"

Depending on type of shares issued to MTN, AXA, Picard, etc, they themselves may not be able to sell during the 180day lock-up period. But the "Underwriters" section includes exceptions which seems to exclude them. Let the lawyers here help with interpreting the language in this section.
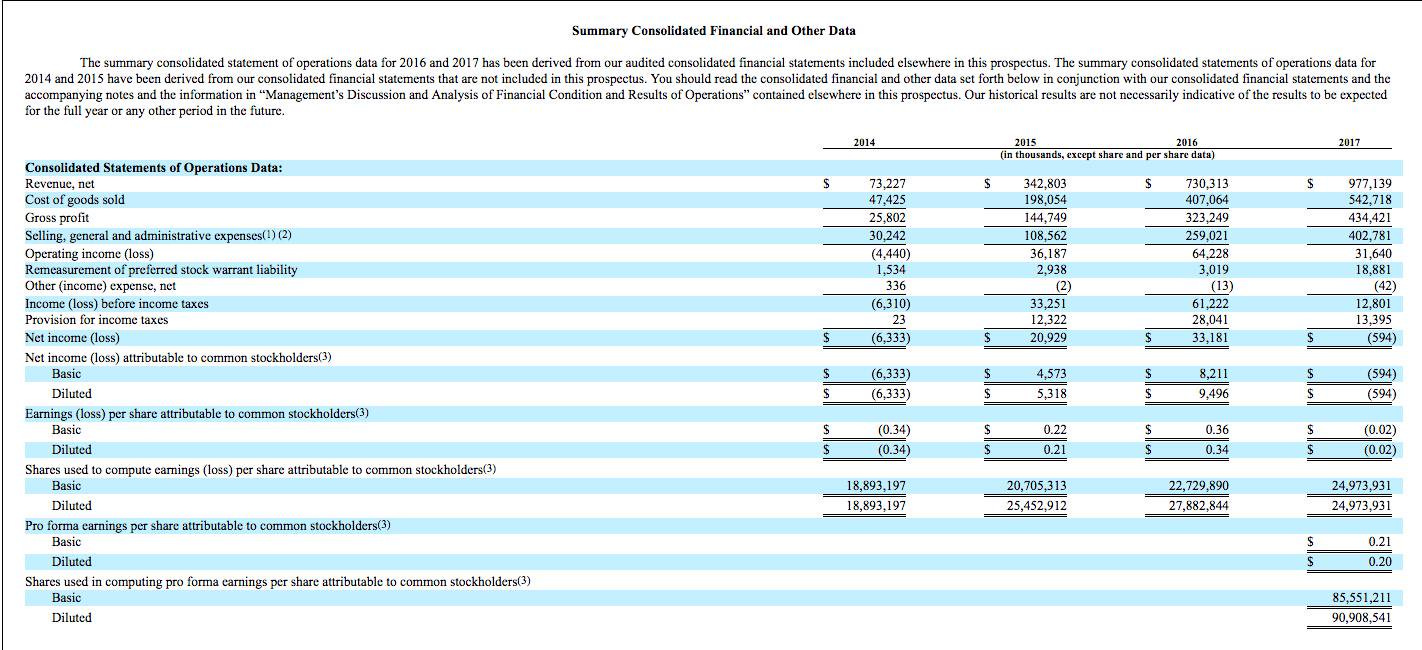
SUMMARY CONSOLIDATED FINANCIAL AND OPERATING DATA
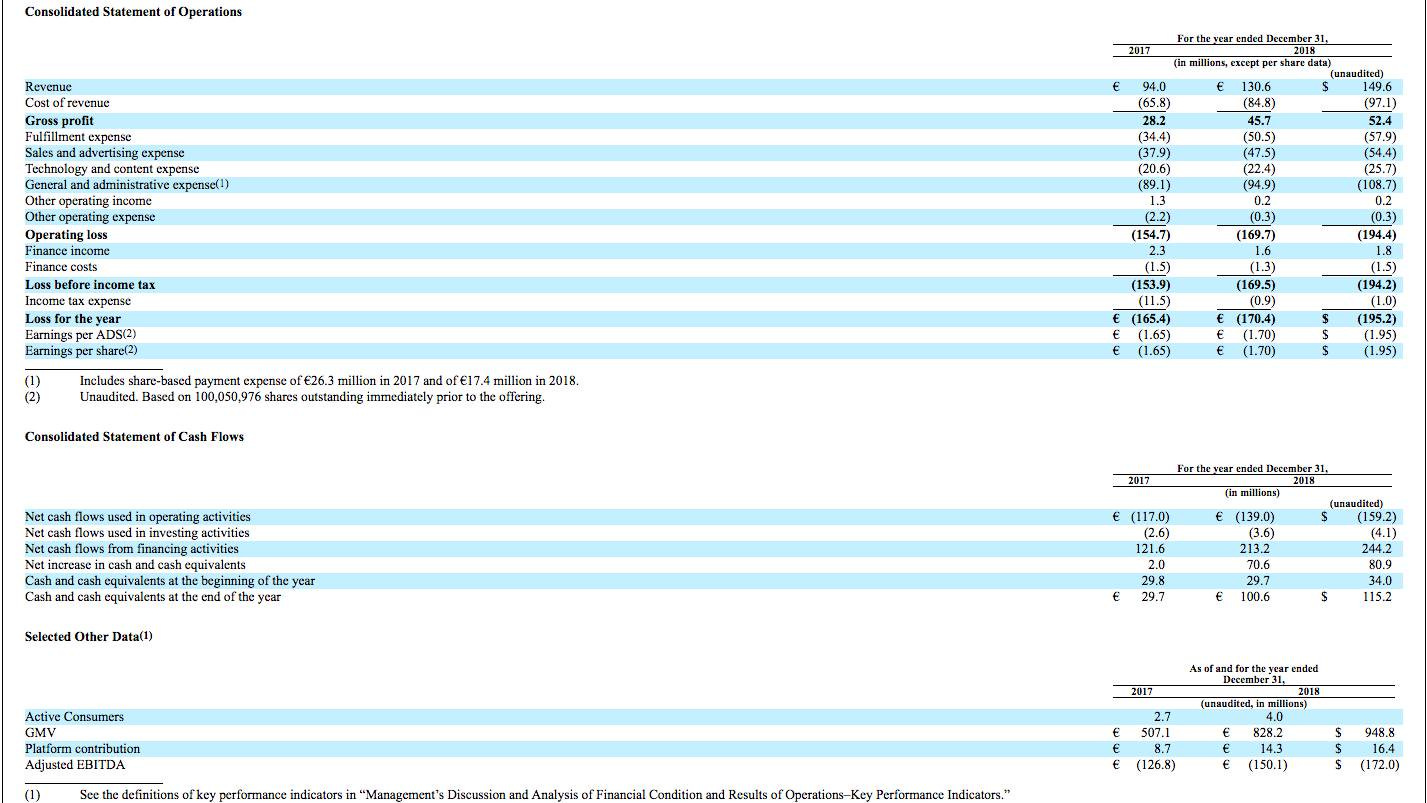
I had earlier indicated in the section where I dealt with platform contribution that it is best to ignore revenue at this point in assessing Jumia’s business because first party & third party GMVs are not expressly provided. So, the next best thing to use is common sizing gross profits as a factor of GMV.
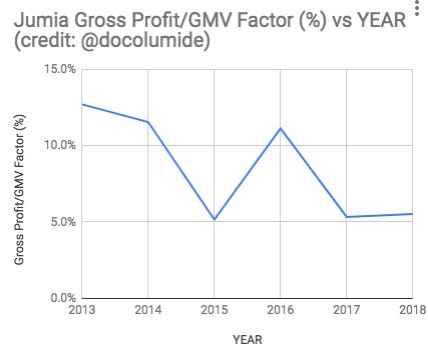
If you chart gross profit as a factor of GMV over past 6 years, it shows this to have settled at ~5% in the last 2 years, which honestly if you ask me is quite shitty.
My benchmark for this Jumia IPO analysis, StitchFix, during their IPO filing had gross margin of 44%. It means StitchFix generated about 9 times! the gross profits generated by Jumia from moving the same amount of inventory in GMV of ~$1B. (Note: StitchFix is 100% 1st party model i.e. GMV = Revenue)

Benchmarked to Amazon: Amazon has not had gross margin <20% for as long as it has had its data publicly available. So, like I said, Jumia’s it's quite shitty!

Nevertheless, *in Africa*, it's preposterous for anyone to compare gross margins possible for ecommerce here with that of US. So, I know this is an African problem. This is proven by the fact that Rocket has comparable margins with our benchmarks in their other ecommerce properties. Having said that Jumia is still shitty by African standards. Benchmarked against my previous online grocery operation (@Gloo_ng), a traditionally thin margin business, which had ~20% gross margin in its last 4 years before we pivoted away from it.


Next is the contribution margin and I must confess that I do not trust the calculation Jumia used to derive their contribution margin in this section because the argument they use about how the costs related to the warehouse, which is primarily used for fulfilment, they say, is "nearly constant"and so are classifying it as not part of the direct fulfilment costs. Fishy.
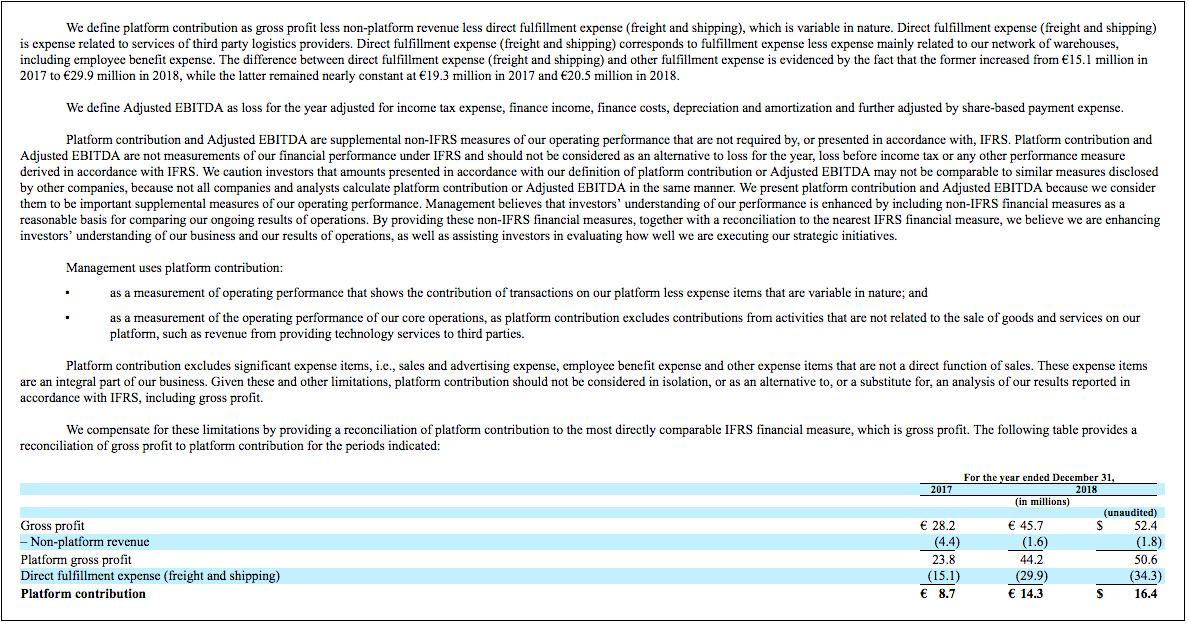
Why don't I trust it? Because they didn't show 6 years historical for this data point for me to check trend and determine the degree indeed to which it is a variable--or fixed/indirect as they are claiming here in above section.
Having said that, since the primary function of the operations of the warehouse is for fulfilment of orders, the most prudent thing to do, to avoid fuzzy accounting, is to allocate ALL fulfillment costs at this level in order to determine PC2. So, I'm opting to use the below!

This basically shows that in 2018, for every €100 gross value of orders delivered by Jumia, on average, across its 14 African locations, it generated a negative contribution of €0.58. It's safe to say that these past 6 years of operations of Jumia have all been negative contribution years, on average, for every order, EVEN BEFORE you remove marketing cost, tech infrastructure and content costs, general & admin expenses, employee emoluments & benefits, finance costs.
Nothing new here, some years back, I had said same thing in one of my tweetstorms.
Using fuzzy language to goose appearance of profitability is standard practise of ecommerce players to con VCs out of more cash. Konga too did it and here's me calling them out on that here.

I digress. Back to the matter at hand.
Next thing to try to determine is "blended Customer Acquisition Cost (CAC)," since that is the closest we will ever get to in finding out customer acquisition costs. Based on the increase in active customers by 1.3million in 2018, and 0.7million in 2017, their blended CAC comes to €37 for 2018 and €54 for 2017. (In the below charts, A-GMV-PU = average GMV per active user; A-GP-PU = average gross profit per active user.)

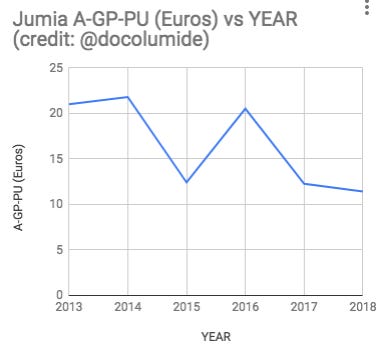
At the present €11 average gross profit per active customer per year, it means it would take Jumia, on average, up to 5 years to break even on Customer Acquisition Costs from gross profits--PROVIDED it has ZERO churn, which we of course know can’t be the case. I leave you to imagine what Jumia's churn rate could be but the F1 so far provides no clue.
Next is the ebitda. And, finally, some good news! Yes, I know the bad news that has been reported by some, like in this article by @qzafrica, is that the chart showing increasingly growing ebitda loss.

But that is the wrong trend to track.
In fact, it is only with the EBITDA that one sees that Jumia may very well indeed ace this to sustainability, provided they can afford to burn another €500 million or so for the next 3 years. The trend line to track is not the gross value of the ebitda losses, which apparently shows it is escalating. Rather, what one should track is ebitda losses AS A FACTOR of GMV. What you observe is that ebitda losses--as a percentage of GMV--are decreasing.

So, as Jumia's GMV scale has increased, ebitda loss as % of that GMV has reduced. In fact, if you plot trend line forward from 2019, it shows they may reach ebitda break even by 2022-23. Summary: Jumia may brute force their way to sustainability despite the nose bleed. Heroes!!!
Even the ebitda loss on average per active user on Jumia is reducing toward break even (zero).

P.S: I’m not going to bother with the section on "Risk Factors." They are clear enough in the explicit black and white ink they are written in. Although they are standard provisions, the ones here read like a show of the forces that are making ecommerce a #turningoningown game in Africa. Furthermore, they validate the same story my foregoing analysis indicates from Jumia's numbers used.
MANAGEMENT’S DISCUSSION AND ANALYSIS OF FINANCIALS & RESULTS

This section is where management attempts to explain and put more context to all the foregoing analysis I have done. Consequently, the approach I will take is to go back to any aspects of my analysis, by tagging the relevant section, and using the additional explanations and context provided by management in their discussion to update my analysis or dig deeper into the numbers.
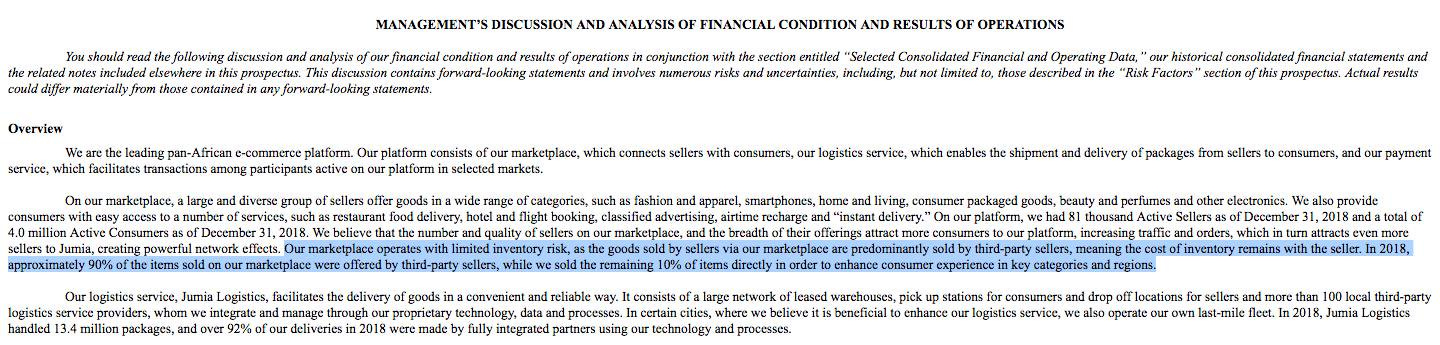
"The Overview" section
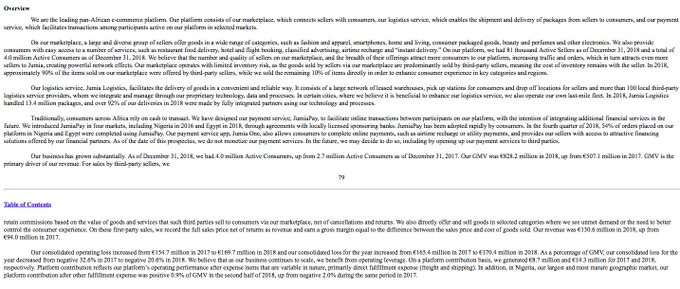
The highlighted part below is a description of what could be termed the "Jumia African Flywheel." It explains how the elements of their marketplace build on themselves, like a virtuous circle, to cause self-sustaining, step-function growth that increases value to/of all its elements.

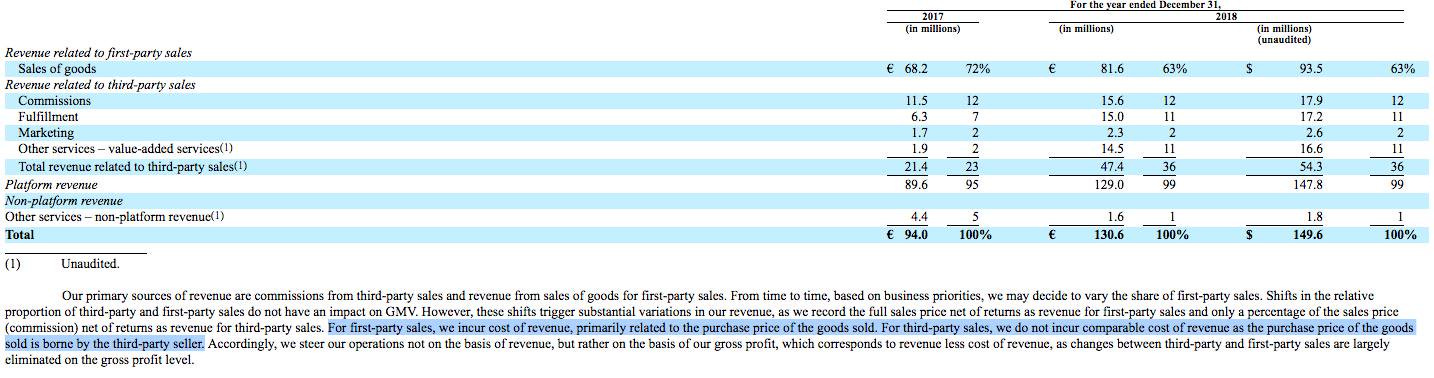
The sentence highlighted in screen capture below shows how well indeed Jumia has pivoted from 1st party ecommerce to 3rd party marketplace ecommerce and should be taken in conjunction with the table shortly after it showing the breakdown.
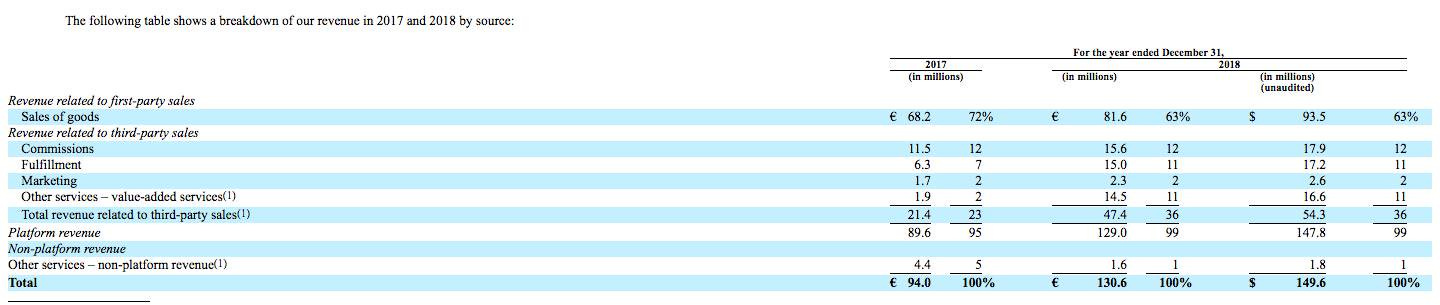
I have seen a few takes on twitter, such as the one in this screen capture, that seem to suggest that Jumia was being economical with their claim that only 10% of their ecommerce revenue is from 1st party. This is not true.

The confusion is from the 72% & 63% put beside the the figures (€68.2m and €81.6m, respectively). But the fact is these numbers do show that ~90% of their GMV is from 3rd party business. Why? Because in there they gave guidance on the accurate treatment of this section via the highlighted sentence just below the breakdown table

This means that you count all of their 1st party GMV, net of returns and discounts, including cost of goods sold (CoGS), as part of the revenue figure. For 3rd party, only commissions/rake charged merchants is counted, excludes CoGS (or, more appropriately, cost of revenue) which, rightly, is a cost borne by 3rd party sellers, as it is their own inventory, and the entire revenue benefit of the GMV should not be counted as part of Jumia's revenue. Otherwise, it would be double counting--because the portion of the GMV that is left after Jumia has deducted its commission is what is paid to the seller and which the seller counts as her own revenue. You cannot therefore count revenue twice from very same single transaction in two separate P&L statements belonging to two separate corporate entities.
So how do we derive ACTUAL GMV Jumia sold as 1st party and as 3rd party? Very simple. In 2017, GMV was €507.1m, out of which €68.2m was 1st party GMV (which also equals revenue to Jumia). Hence, 3rd party GMV = €507.1m -€68.2m = €438.9m, which is 87% of total €507.1m. Similarly in 2018, GMV was €828.2m, out of which €81.6m was 1st party GMV (which also equals revenue to Jumia). Hence, 3rd party GMV = €828.2m - €81.6m = €746.6m, which is 90% of total €828.2m. Hence, the 72% and 63% beside 1st party revenue figures are NOT a common-sizing, as it is called, of the GMV figures but rather of the revenue figures accruing to Jumia.

There are a few set of important numbers, even though not explicitly provided, that can be teased out from the foregoing:
1) Gross profits/margin of Jumia's 1st party ecommerce business:
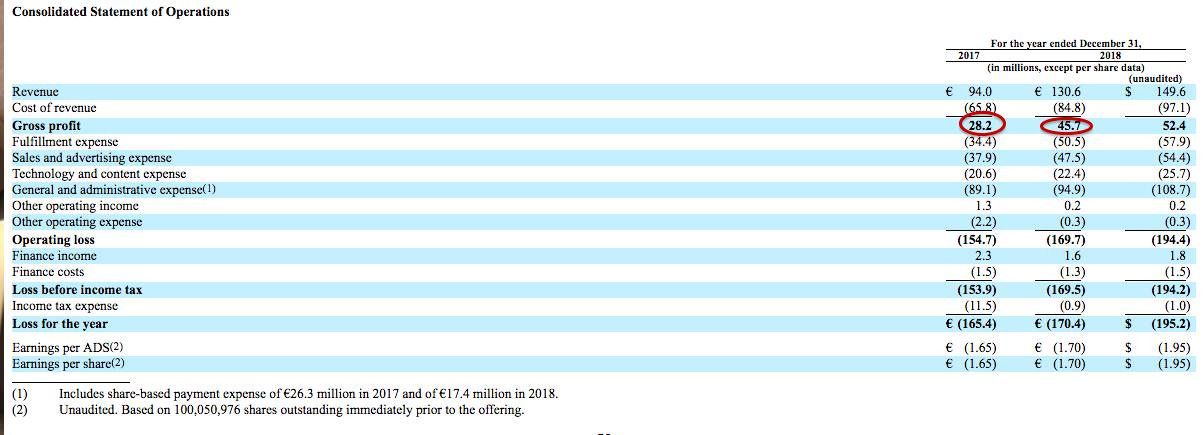
In 2017, revenue from all its lines of business was €94m. If we back out all portions of this revenue that was not 1st party ecommerce, we get €25.8m. Total gross profits from all lines of business for 2017 was reported as €28.2m. Therefore, gross profits attributable only to 1st party ecommerce business in 2017 is €28.2m - €25.8m, or €2.4m, which as a percentage (%) of total 1st party GMV (or revenue, in this instance) of €68.2m, gives us 3.5% gross margin! Using this same approach, you derive gross profits for 2018 1st party as €3.3m and gross margin as 4.1%
2.) Average commissions % charged by Jumia to 3rd party sellers: this gives us an idea of the market power that Jumia really has compared to its suppliers and 3rd party sellers (Porter's 5 Forces)

Compared to 1 above, this is more straight forward. For 2017, just divide the commissions from 3rd party ecommerce business (€11.5m) by GMV attributable only to 3rd party business, which we earlier determined above to be €438.9m, which = 2.6%. Similarly, for 2018, if you carry out same working, you will get 2.1%.
What conclusions can we deduce from the foregoing?
1) Jumia’s core ecommerce business is so much shittier that it appears! Why?! Because Jumia can only rake off just about ~2% from the GMV moving across its marketplace platform! That is a supplier/seller surplus. Jumia has absolutely NO MARKET POWER compared to its suppliers/sellers!
2.) If one common-sizes the 1st + 3rd party ecommerce incomes (in 2017, €2.4m + €11.5m = €13.9m and in 2018, €3.3m+€15.6m = €18.9m) against the total income from ALL lines of business (in 2017, €28.2m and in 2018 €52.3m), you begin to see that even though Jumia's core business is ecommerce, that core leans heavily on the crutches of their VAS and ancillary services business, since income coming from these are relatively substantial.

I dare say, because these VAS and ancillary services will definitely have MUCH lower cost structures, especially infrastructure and head count related costs, they are integral to Jumia's sustainability strategy--or appearance of same. Hence, bringing everything under the Jumia umbrella brand 2 years ahead of this IPO was a genius move. They're able to use the these as crutches to paint a rosier picture for the core business upon which their fund raising stories and IPO roadshow would be based.
This should however make us revisit my benchmarking against StitchFix's numbers, to do an apples-for-apples comparison and for perspective, as StitchFix is 100% ecommerce, unlike Jumia that has hotels, travel, etc bolted to their ecommerce. StitchFix's GMV therefore shows 22 times higher quality than Jumia’s! Wow!!!
Overview section, continued.
Still on the "Overview" section of management's discussion, you see they indicated they "handled" 13.4m packages. "Handle" can be interpreted in many ways but I don't have time anymore for these interpretations, you ought to get the drift, aka MO, by now. So we'll just take it at face value. ;-)
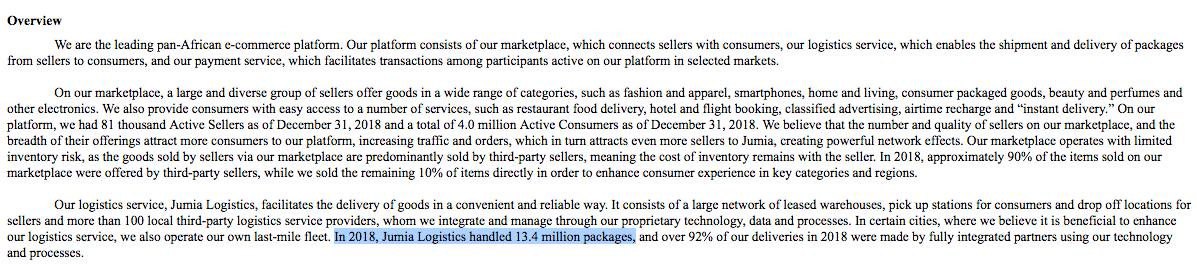
Caveat emptor: at face value, it means Jumia’s 2018 average package value was €828.2m/13.4m = €61.8/package. If we factor in Jumia’s quixotic GMV definition we earlier addressed and which include cancellations (orders that were NEVER shipped out), their average package value would be much lower. How much lower? We'll find that out if they provide us with % of GMV value or packages that were cancelled. For now, we'll live with €61.8/package—and a very good dose of sodium chloride.
Furthermore, it implies that, each unique customer, ON AVERAGE, ordered goods worth €828.2m divided by 4m (number of active customers) in 2018, which is €207. It also means this €207 average annual GMV purchased per active Jumia user in 2018, ON AVERAGE, were ordered across 13.4m/4m or 3.35 packages/active customer. These figures too should be taken with a good dose of salt because of the key words used in their definitions of GMV data: "placed," "received," "handled" as they include order cancellations and/or returns. (We will revisit this if we are later provided with cancellation figures.)
JumiaPay.
The next part in the “Overview” section is JumiaPay. Frankly, this 54% figure quoted for Nigeria and Egypt, implying more of their transactions there are more of online payment than Cash is quite suspicious.
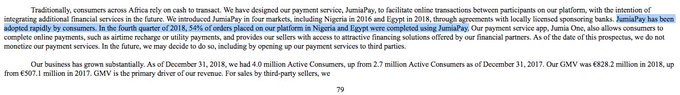
Why? Because it is inconsistent with their prior statement that “cash is still a significant part of African transactions” traditionally. And that figure flies in the face of CBN and NIBSS data in that regard. But let's go on. If we find additional data point in their filing, we'll revisit this also.
Key Performance Indicators (KPI)
The KPI section basically has 3 KPIs. This should be more comprehensive as far as ecommerce KPIs go. So, I will relabel this section as "KPI for valuation purposes” which is what these three (3) listed (active customer, GMV and ebitda) are typically used for. So, let's be clear that enterprise valuation is Rocket's actual KPI for measuring Jumia. Nothing wrong with this: I am just expressly surfacing it here so it provides context to how we see them discuss this subsequently.
How are these 3 used to derive valuations? In following manner:
1) GMV: valuation derived by multiplying GMV by the equivalent EV/GMV multiples of other ecommerce ventures closely comparable to Jumia. The 2 that I feel come closest, considering Jumia is 90% 3rd party marketplace model are FlipKart in India & Alibaba's TMall in China. I am not familiar w/ Alibaba's TMall's numbers but FlipKart was acquired by Walmart at a $21Billion EV or 2.8x multiple of last fiscal year's GMV. Using exactly the same value as comparable for Jumia, we get $2.32Billion as Jumia's IPO valuation--using FlipKart as benchmark.
2.) Active Customers: using the same approach, FlipKart was acquired by Walmart at $21Billion EV with 54million active customers, which means Walmart valued each active FlipKart customer at $389. Using same bench mark, that gives Jumia a valuation of $1.56Billion.
3.) EBITDA: this is a negative value for Jumia and, from the little I know, one can’t use a negative figure as a basis for valuation. I may be wrong, though.
Notwithstanding, using an average of both valuation approaches, as the finance types are wont to do, we get an average EV of $1.94Billion as Jumia's base case valuation. Automatically, $2.32Billion will be best case and $1.56Billion worst case. Considering, that Jumia has a higher market risk and worse gross margins compared to FlipKart, I will hazard that its valuation will tend between the worst case and base case i.e. $1.6Billion and $1.94Billion. Nevertheless, the IPO will involve investors for who these considerations are of little importance, just as long as they get a sliver of exposure to African ecommerce market, which could result in them driving Jumia's valuation toward (or even more than) best case of $2.32Billion.
<End of Part 1, which basically marks end of my analysis that I had done days after the F1 became public, ahead of the actual listing. Part 2 continues from where I stopped my analysis of the F1 filing. Stay tuned by subscribing to Founder Collective Africa, so you don’t miss it.>